Viewing FRED Data
![]()
Using the Python PublicDataReader library, you can easily query the economy data provided by FRED.
PublicDataReader
PublicDataReader is a Python library that can automatically retrieve public data. With this library, you can easily retrieve public data provided by open API services such as FRED. Public data that requires an authentication key can be retrieved using an authentication key, and data that does not require an authentication key can be retrieved without a separate authentication procedure. With PublicDataReader, you can automate the process of finding API specifications, making requests, and organizing returned data in a typical public data search, and you can also automate data collection and processing when searching for data published on the web. This simplifies code writing and makes public data retrieval more convenient.
How to Install PublicDataReader
- Choose one of the following depending on your Operating System (OS):
- Windows: Run CMD (Command Prompt)
- Mac: Run Terminal
- Enter and execute the following Shell command:
pip install PublicDataReader --upgrade
Request FRED API
To use the API service provided by FRED, you need an authentication key. To get an authentication key, you can sign up for FRED API and fill out a simple application at Fill out a short application form at FRED API Key.
Search for a series
A “series” in FRED is a set of data that represents changes in a specific economic indicator over time. These series contain a series of consecutive data points to represent changes in an economic indicator over time. Each series represents a specific economic indicator (e.g., unemployment rate, GDP, inflation, etc.), and the data is collected over a specific period of time (days, months, quarters, years, etc.). These series help you analyze and understand economic patterns and trends.
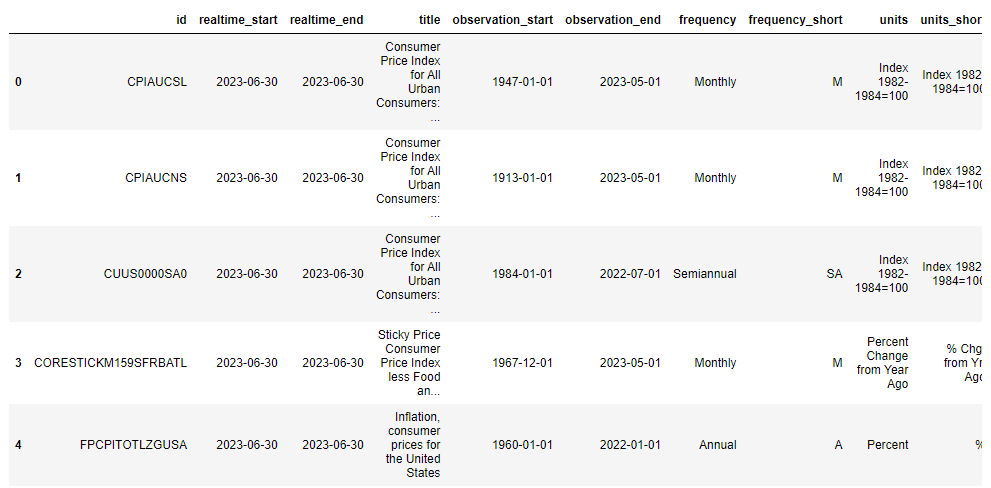
To search for a series like this, you can enter series_search in api_name, an argument to the api.get_data() method, and a keyword for the series you want to search for in search_text. In the search results, you can see the ID value of the desired series. Use the ID value of this series to look up the series data. For example, to see the series ID value for the consumer price index, a metric related to inflation, you can type consumer price index in search_text.
search_text = "consumer price index"

result = api.get_data(
    api_name="series_search",
    search_text=search_text
)
result.head()
U.S. Consumer Price Index Consumer Price Index (CPI)
- Series name: Consumer Price Index for All Urban Consumers: All Items in U.S. City Average
- Unit: Index 1982-1984=100, not seasonally adjusted.
- Frequency: Monthly
- FRED URL: https://fred.stlouisfed.org/series/CPIAUCNS
- Source: U.S. Bureau of Labor Statistics
def CPI() -> pd.DataFrame:
    """Consumer Price Index (CPI) series data lookup function"""

    # series ID value
    series_id = "CPIAUCNS"

    # Get series data
    df = api.get_data(
        api_name="series_observations",
        series_id=series_id
    )

    # Convert value column to numeric type
    df['value'] = pd.to_numeric(df['value'], errors="coerce")
    # convert date column to date
    df['date'] = pd.to_datetime(df['date'])
    # set date column as an index
    df = df.set_index("date")

    # create a value last month column
    df['value_last_year'] = df['value'].shift(12)
    df['CPI(YoY)'] = (df['value'] - df['value_last_year']) / df['value_last_year'] * 100

    # Select only year-ago value columns
    df = df[['CPI(YoY)']]
    return df
U.S. Personal Consumption Expenditures Personal Consumption Expenditures (PCE)
- Series name: Personal Consumption Expenditures: Chain-type Price Index
- Unit: Index 2012=100, seasonally adjusted.
- Frequency: Monthly
- FRED URL: https://fred.stlouisfed.org/series/PCEPI
- Source: U.S. Bureau of Economic Analysis
def PCE() -> pd.DataFrame:
    """Personal Consumption Expenditures (PCE) series data lookup function"""

    # series ID value
    series_id = "PCEPI"

    # Get series data
    df = api.get_data(
        api_name="series_observations",
        series_id=series_id
    )

    # Convert value column to numeric type
    df['value'] = pd.to_numeric(df['value'], errors="coerce")
    # convert date column to date
    df['date'] = pd.to_datetime(df['date'])
    # set date column as an index
    df = df.set_index("date")

    # create a value last month column
    df['value_last_year'] = df['value'].shift(12)
    df['PCE(YoY)'] = (df['value'] - df['value_last_year']) / df['value_last_year'] * 100

    # Select only year-ago value columns
    df = df[['PCE(YoY)']]
    return df
U.S. Producer Price Index (PPI)
- Series name: Producer Price Index by Commodity: Final Demand
- Unit: Index November 2009=100, not seasonally adjusted.
- Frequency: Monthly
- FRED URL: https://fred.stlouisfed.org/series/PPIFID
- Source: Source: U.S. Bureau of Labor Statistics
def PPI() -> pd.DataFrame:
    """Producer Price Index (PPI) series data lookup function"""

    # series ID value
    series_id = "PPIFID"

    # Get series data
    df = api.get_data(
        api_name="series_observations",
        series_id=series_id
    )

    # Convert value column to numeric type
    df['value'] = pd.to_numeric(df['value'], errors="coerce")
    # convert date column to date
    df['date'] = pd.to_datetime(df['date'])
    # set date column as an index
    df = df.set_index("date")

    # create a value last month column
    df['value_last_year'] = df['value'].shift(12)
    df['PPI(YoY)'] = (df['value'] - df['value_last_year']) / df['value_last_year'] * 100

    # Select only year-ago value columns
    df = df[['PPI(YoY)']]
    return df
U.S. Federal Funds Interest Rate
- Series Name: Federal Funds Target Range - Upper Limit
- Unit: Percentage, not seasonally adjusted.
- Frequency: Daily, 7 days a week.
- FRED URL: https://fred.stlouisfed.org/series/DFEDTARU
- Source: Board of Governors of the Federal Reserve System (US)
def FED_RATE() -> pd.DataFrame:
    """Function to fetch the target series data for Federal Funds Rate"""

    # Series ID value
    series_id = "DFEDTARU"

    # Retrieve series data
    df = api.get_data(
        api_name="series_observations",
        series_id=series_id
    )

    # Create a column by converting the 'value' column to numeric
    df['FED RATE'] = pd.to_numeric(df['value'], errors="coerce")
    # Convert the 'date' column to datetime
    df['date'] = pd.to_datetime(df['date'])

    # Set the 'date' column as index
    df = df.set_index('date')
    # Select only the Federal Funds Rate column
    df = df[['FED RATE']]

    return df
Case-Shiller U.S. Home Price Index
- Series Name: S&P/Case-Shiller U.S. National Home Price Index
- Unit: Index with base January 2000=100, seasonally adjusted.
- Frequency: Monthly
- FRED URL: https://fred.stlouisfed.org/series/CSUSHPISA
- Source: S&P Dow Jones Indices LLC
def CS() -> pd.DataFrame:
    """Function to retrieve the Case-Shiller National Home Price Index series data"""

    # Series ID value
    series_id = "CSUSHPISA"

    # Retrieve series data
    df = api.get_data(
        api_name="series_observations",
        series_id=series_id
    )

    # Convert 'value' column to numeric
    df['value'] = pd.to_numeric(df['value'], errors="coerce")
    # Convert 'date' column to datetime
    df['date'] = pd.to_datetime(df['date'])
    # Set 'date' column as index
    df = df.set_index("date")

    # Generate column for same month value of last year
    df['value_last_year'] = df['value'].shift(12)
    df['CS(YoY)'] = (df['value'] - df['value_last_year']) / df['value_last_year'] * 100

    # Select only the column with YoY changes
    df = df[['CS(YoY)']]

    return df
U.S. Economic Growth Rate (Real GDP Growth Rate (annualized) for the previous quarter)
- Series Name: Real Gross Domestic Product
- Unit: Change from previous period, seasonally adjusted annual rate
- Frequency: Quarterly
- FRED URL: https://fred.stlouisfed.org/series/A191RL1Q225SBEA
- Source: U.S. Bureau of Economic Analysis
def GDP() -> pd.DataFrame:
    """Function to fetch the US GDP growth rate (annualized QoQ) series data"""

    # Series ID value
    series_id = "A191RL1Q225SBEA"

    # Retrieve series data
    df = api.get_data(
        api_name="series_observations",
        series_id=series_id
    )

    # Convert 'value' column to numeric
    df['GDP RATE'] = pd.to_numeric(df['value'], errors="coerce")
    # Convert 'date' column to datetime
    df['date'] = pd.to_datetime(df['date'])
    # Set 'date' column as index
    df = df.set_index("date")
    # Select only the GDP growth rate column
    df = df[['GDP RATE']]

    return df
Retrieving Data
cpi = CPI()
pce = PCE()
ppi = PPI()
fed_rate = FED_RATE()
cs = CS()
gdp = GDP()
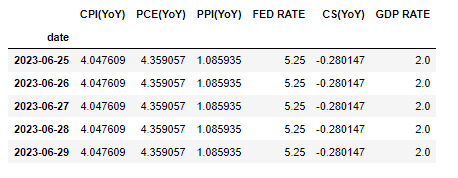
Merging Data
# Merge data
dfs = [cpi, pce, ppi, fed_rate, cs, gdp]
# Convert to daily frequency and fill missing values with previous values
dfs = list(map(lambda x: x.resample("D").asfreq().ffill(), dfs))
# Merge data
df = pd.concat(dfs, axis=1).ffill()
# Set period
start_date = "2019-01-01"
target = df[start_date:]

target.tail()
Visualizing Data with plotly
import plotly.express as px
fig = px.line(target, x=target.index, y=list(target.columns))

fig.update_layout(
    title={
        'text': "Key Global Economic Indicators",
        'y':0.95,
        'x':0.5,
        'xanchor': 'center',
        'yanchor': 'top'},
    xaxis_title="Date",
    yaxis_title="Value",
)

fig.show()
댓글남기기