AutoViz를 이용하면 데이터 전처리 및 시각화를 자동화할 수 있다.
AutoViz
0.1.50 이후 버전의 AutoViz를 사용하면 자동으로 데이터를 분석해주고, 데이터 정제 방법도 제안해준다. 누락값, 적은 수의 카테고리, 무한한 값 그리고 혼합 데이터 유형 등을 찾아주는 작업을 수행한다. 이러한 기능을 활용하면 데이터 정제 작업에 소요되는 시간을 줄일 수 있다.
AutoViz 설치
다음과 같이 Shell 명령을 통해 최신 버전의 AutoViz를 설치한다.
pip install autoviz --upgrade
예제 데이터
유명한 아이리스 데이터를 판다스 데이터프레임으로 불러온다.
import pandas as pd

# 예제 데이터 URL
url = 'https://archive.ics.uci.edu/ml/machine-learning-databases/iris/iris.data'

# 예제 데이터를 데이터프레임으로 읽기
df = pd.read_csv(url, names=['sepal length','sepal width','petal length','petal width','target'])
AutoViz 임포트하기
이제 AutoViz 라이브러리를 임포트한다. AutoViz_Class 를 이용해 AutoViz 인스턴스를 생성한다.
from autoviz.AutoViz_Class import AutoViz_Class

# AutoViz 인스턴스 생성
AV = AutoViz_Class()
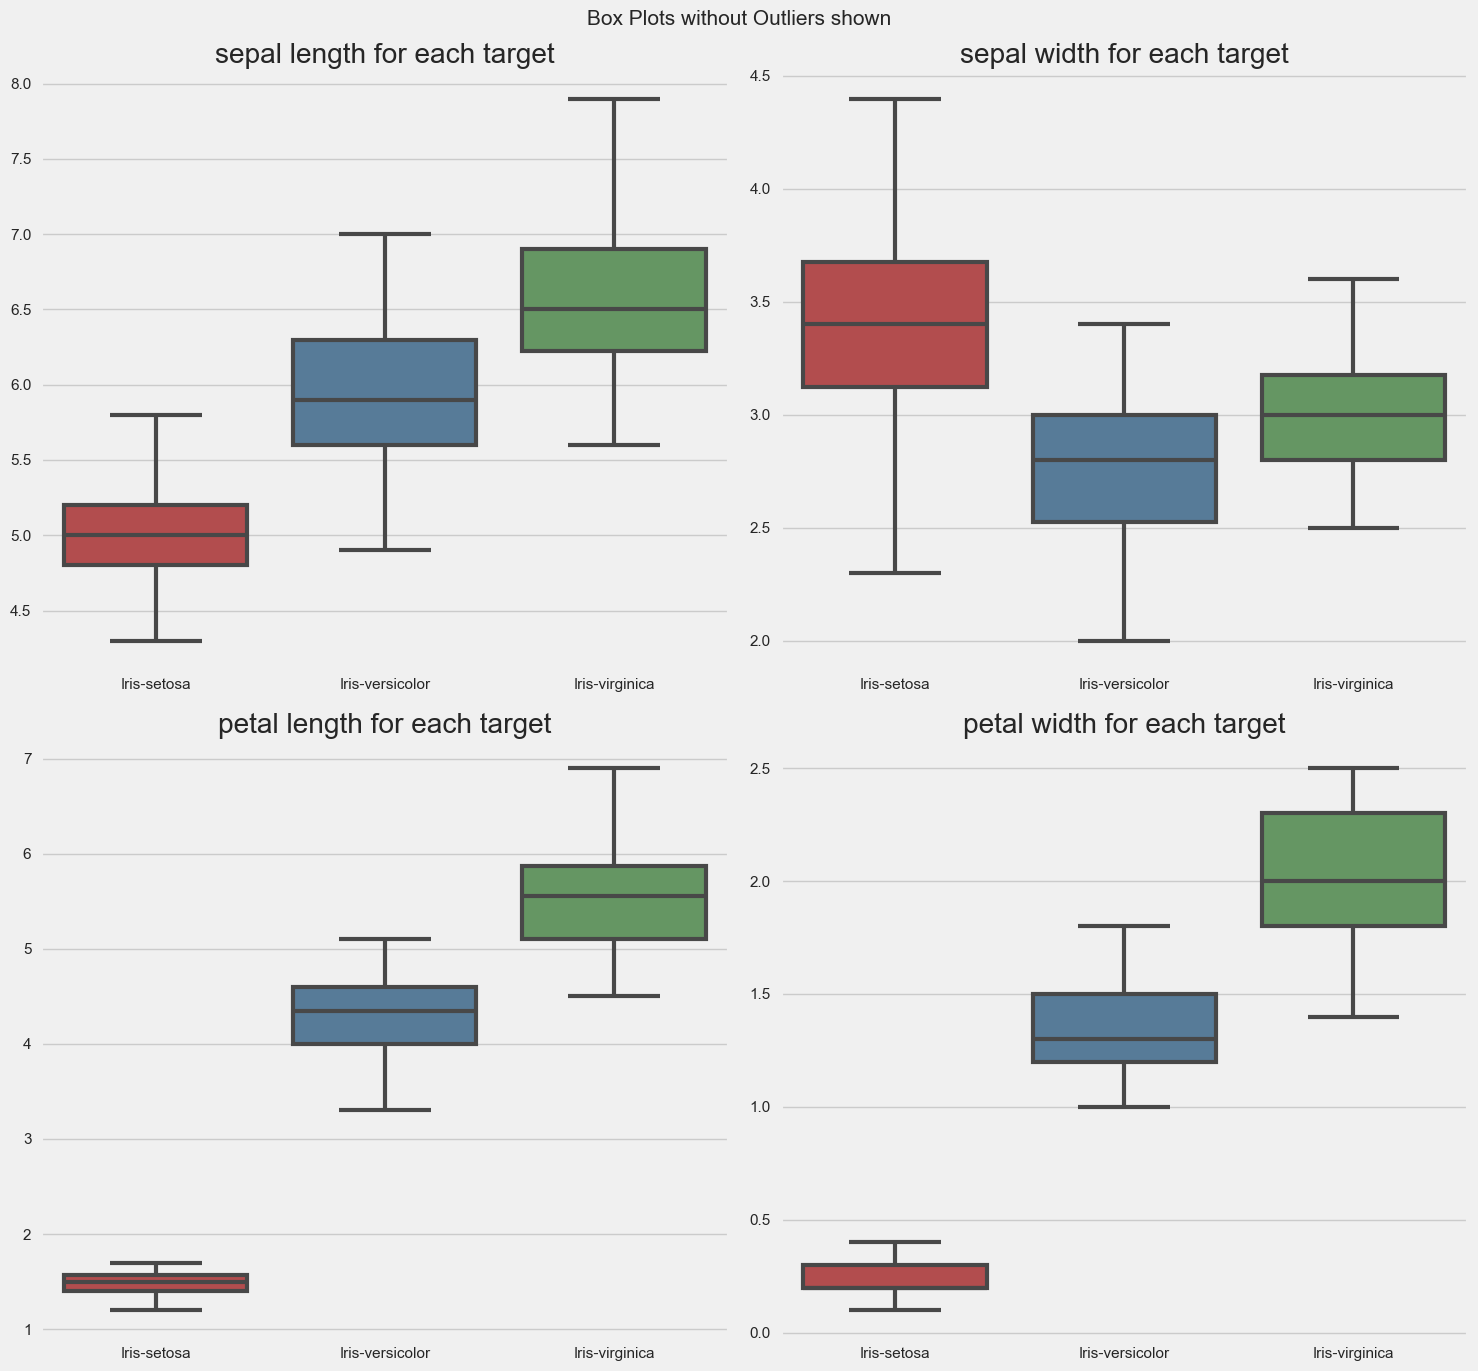
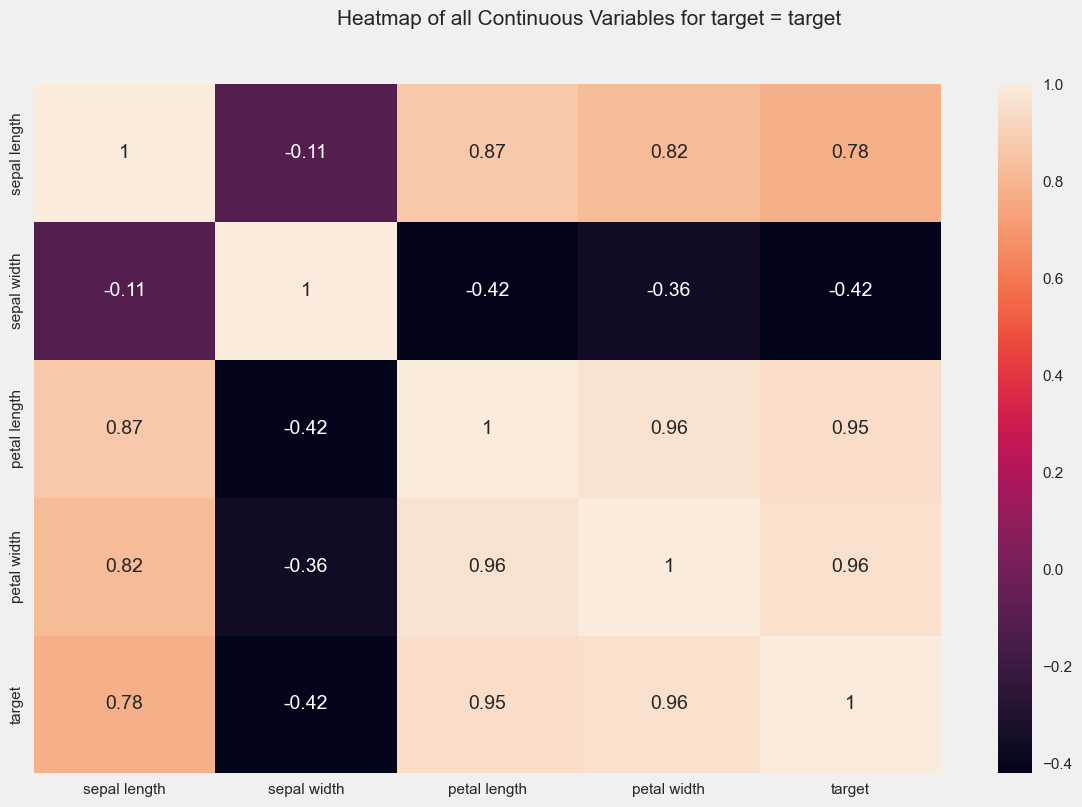
시각화 실행하기
AV.AutoViz() 이용 시 아래와 같이 옵션을 지정하면 다양한 형태로 시각화 결과를 출력할 수 있다.
chart_format='bokeh: bokeh 대시보드를 주피터 노트북에서 실행chart_format='server: 웹 브라우저에서 실행chart_format='html: 로컬 경로에 동적 HTML 파일 저장chart_format='png,chart_format='svg,chart_format='jpg: Matplotlib 차트 인라인 실행verbose=0: 주피터 노트북에 표시 (최소 정보)verbose=1: 주피터 노트북에 표시verbose=2: 로컬에 저장
%matplotlib inline

# 시각화 결과 저장 경로
save_plot_dir = "./result"

# 자동 시각화 실행
dft = AV.AutoViz(
    filename="",
    sep=",",
    depVar="target",
    dfte=df,
    header=0,
    verbose=2,
    lowess=False,
    chart_format="png",
    max_rows_analyzed=150000,
    max_cols_analyzed=30,
    save_plot_dir=save_plot_dir
)
Shape of your Data Set loaded: (150, 5)
#######################################################################################
######################## C L A S S I F Y I N G  V A R I A B L E S  ####################
#######################################################################################
Classifying variables in data set...
Data cleaning improvement suggestions. Complete them before proceeding to ML modeling.
| Nuniques | dtype | Nulls | Nullpercent | NuniquePercent | Value counts Min | Data cleaning improvement suggestions | |
|---|---|---|---|---|---|---|---|
| petal length | 43 | float64 | 0 | 0.000000 | 28.666667 | 0 | |
| sepal length | 35 | float64 | 0 | 0.000000 | 23.333333 | 0 | |
| sepal width | 23 | float64 | 0 | 0.000000 | 15.333333 | 0 | |
| petal width | 22 | float64 | 0 | 0.000000 | 14.666667 | 0 |
Printing upto 30 columns max in each category:
Numeric Columns : ['sepal length', 'sepal width', 'petal length', 'petal width']
Integer-Categorical Columns: []
String-Categorical Columns: []
Factor-Categorical Columns: []
String-Boolean Columns: []
Numeric-Boolean Columns: []
Discrete String Columns: []
NLP text Columns: []
Date Time Columns: []
ID Columns: []
Columns that will not be considered in modeling: []
4 Predictors classified...
No variables removed since no ID or low-information variables found in data set
################ Multi_Classification problem #####################
Columns to delete:
' []'
Boolean variables %s
' []'
Categorical variables %s
' []'
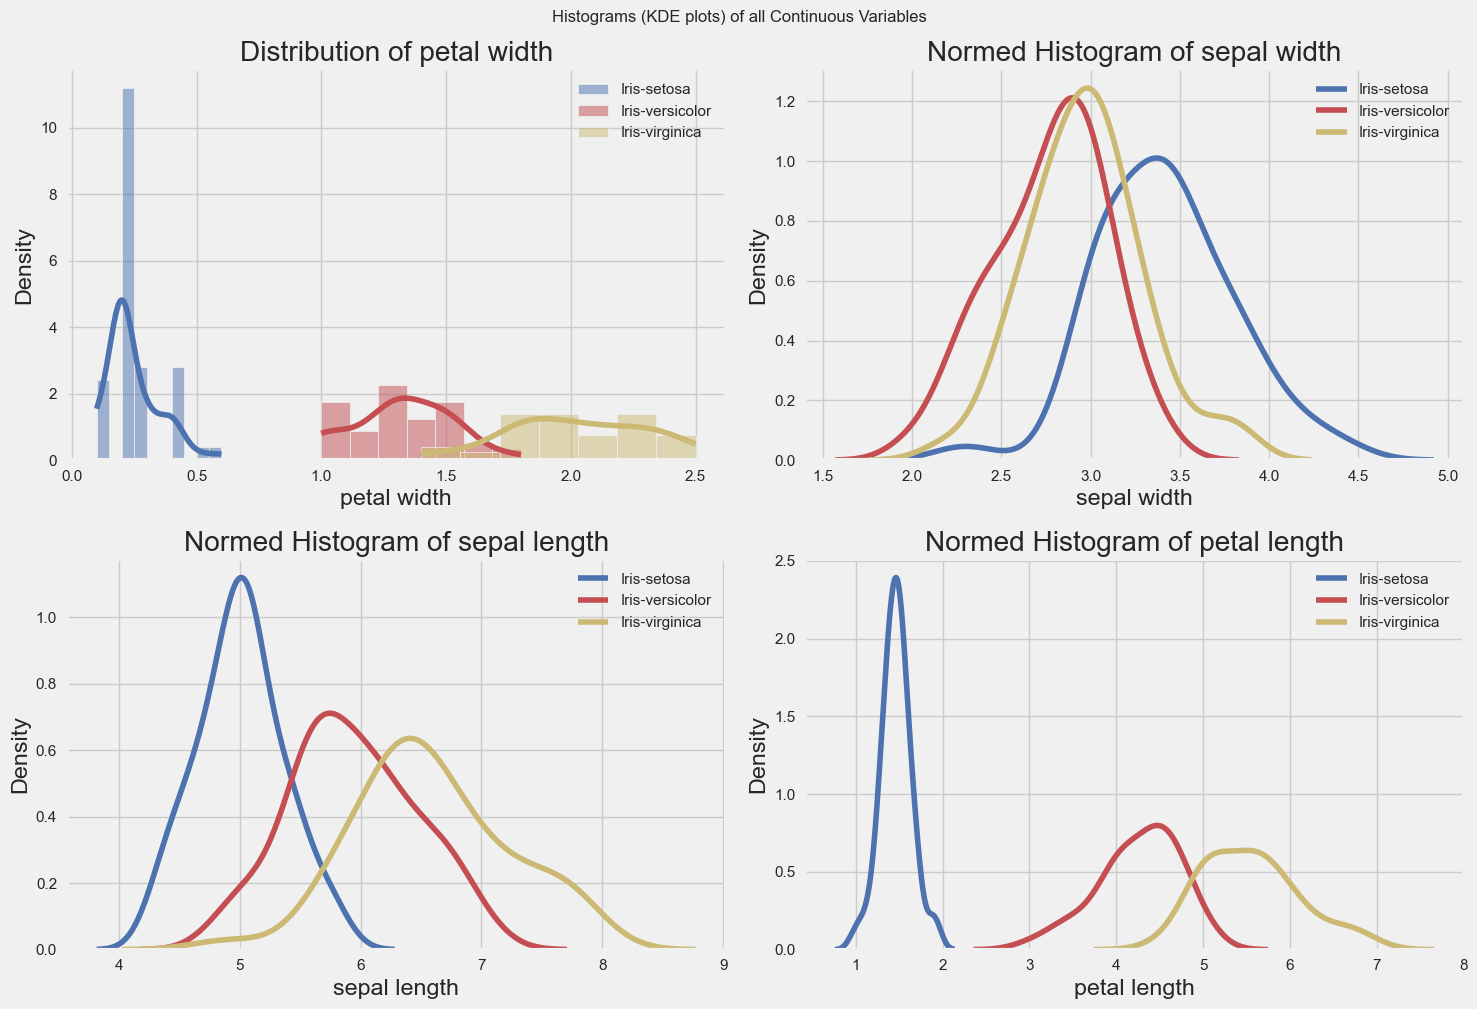
Continuous variables %s
" ['sepal length', 'sepal width', 'petal length', 'petal width']"
Discrete string variables %s
' []'
Date and time variables %s
' []'
ID variables %s
' []'
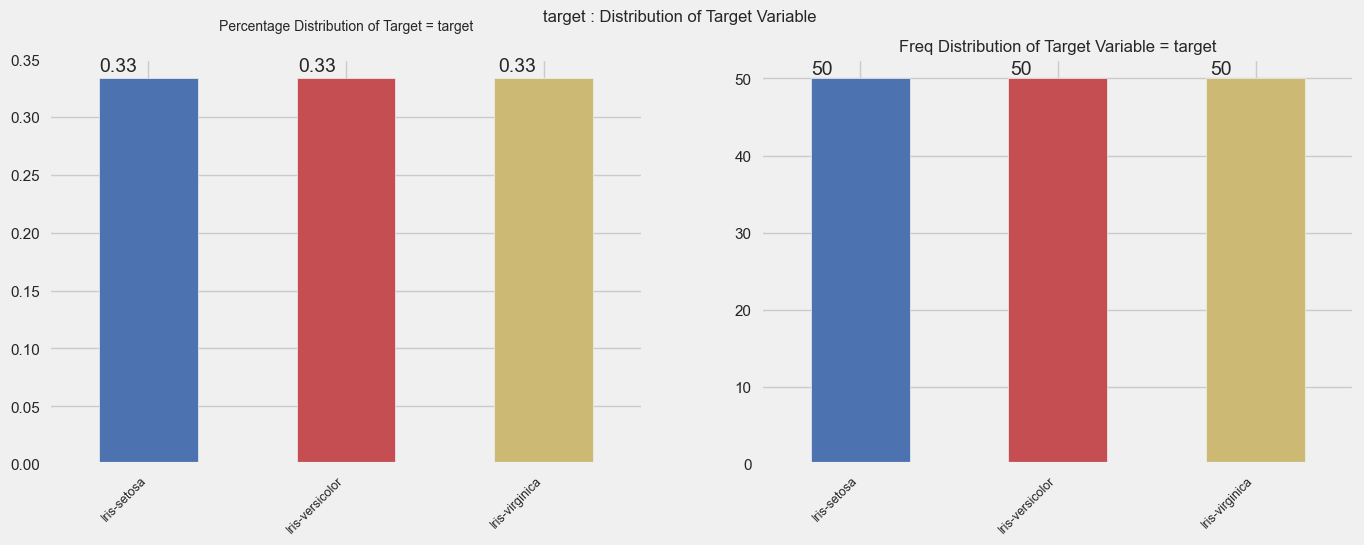
Target variable %s
' target'
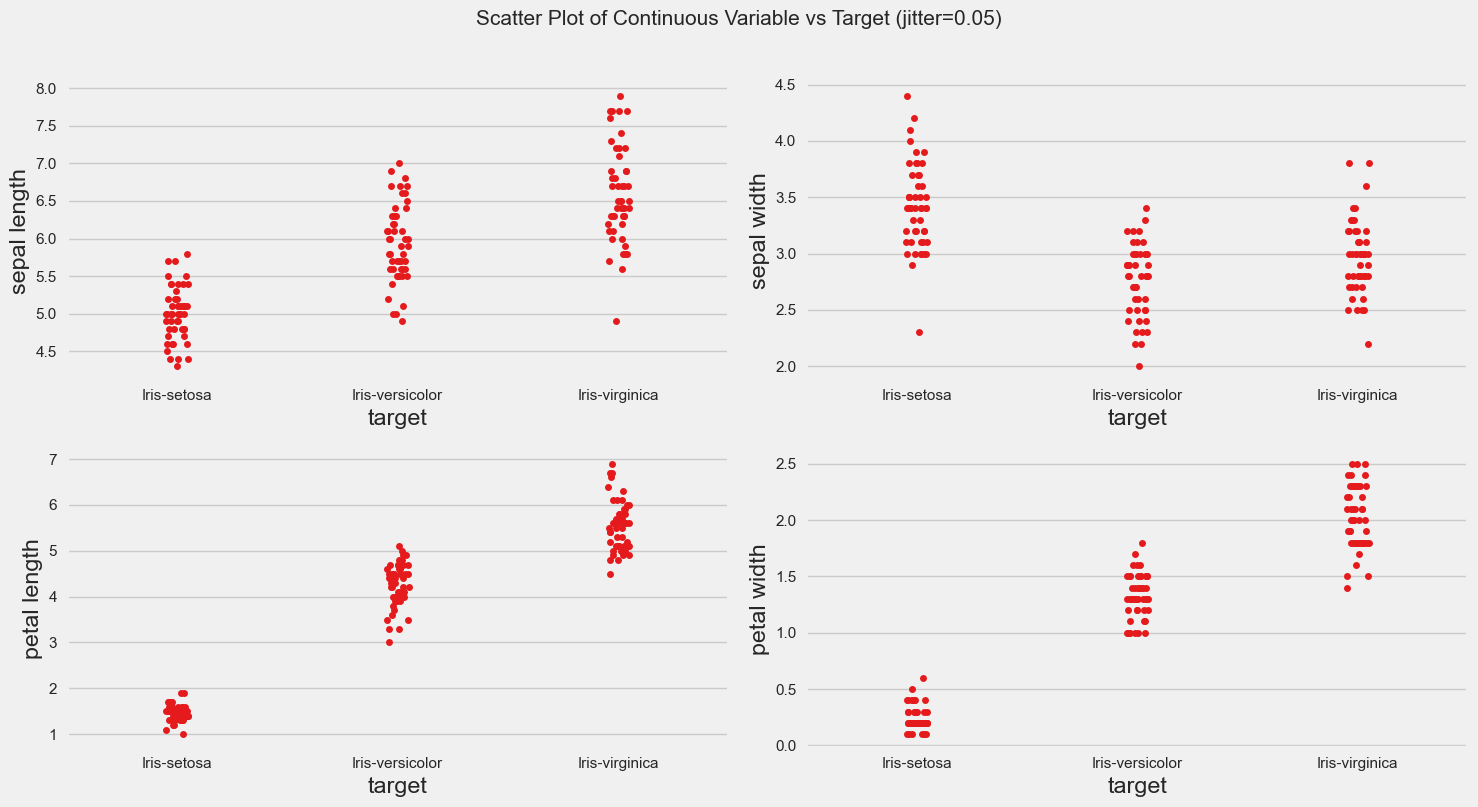
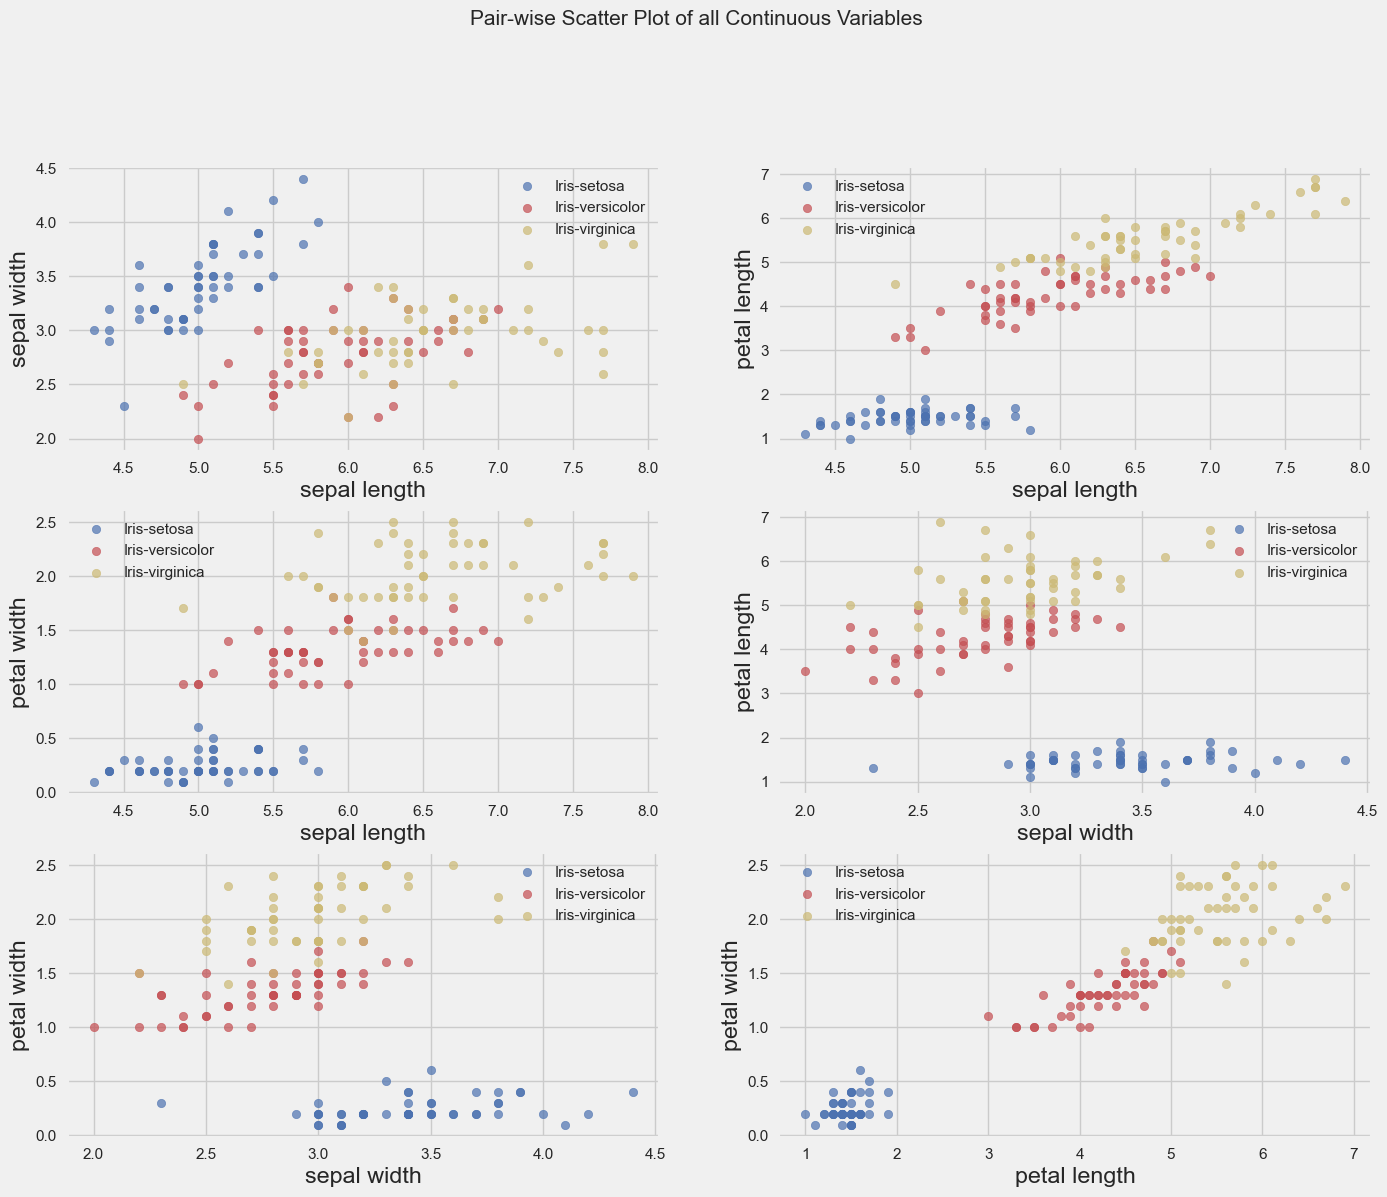
Total Number of Scatter Plots = 10
No categorical or boolean vars in data set. Hence no pivot plots...
No categorical or numeric vars in data set. Hence no bar charts.
All Plots are saved in ./result\target
Time to run AutoViz = 2 seconds
댓글남기기